# 手动部署Elasticsearch
# 简介
- ELK集群 是Logstash、Elasticsearch、Kibana的集合,它主要被应用于日志的收集、分析和存储。其中,Elasticsearch负责日志的分析和存储,Logstash负责日志的收集,而Kibana则负责界面展示。由于ELK集群的各个组件可以互相配合使用,并且可以高效地满足很多应用场景的需求,因此ELK是目前主流的日志分析系统解决方案之一。
- EFK集群 是Elasticsearch、FileBeat和Kibana的集合。与ELK不同的是,FileBeat替代了Logstash,负责日志的收集。EFK集群适用于需要日志收集、分析以及实时监控的场景。其中,Elasticsearch负责数据的存储、分析和搜索,FileBeat负责日志的收集,而Kibana则负责界面展示。 ELK 是一个由三个开源软件工具组成的数据处理和可视化平台,包括 Elasticsearch、Logstash 和 Kibana。这些工具都是由 Elastic 公司创建和维护的。 Elasticsearch 是一个分布式的搜索和分析引擎,可以将大量数据存储在一个或多个节点上,支持实时搜索、分析和聚合,提供高性能的全文搜索、复杂查询和分析能力。 Logstash 是一个数据采集和处理工具,可以将来自各种数据源的日志数据收集、转换、过滤和存储到 Elasticsearch 中,从而实现对数据的集中管理和分析。 Kibana 是一个数据可视化和分析平台,可以使用其可视化界面来创建仪表盘、图表、地图和警报,对 Elasticsearch 中的数据进行交互式分析和可视化展示。 ELK 平台结合了这三个工具的功能,提供了一个完整的解决方案,能够满足各种数据处理和分析的需求。ELK 平台被广泛应用于日志分析、安全监控、业务分析等领域。
ELK 7.0.x 开始自带 OpenJDK ELK 7.8.0 开始支持 ARM64 架构 V8微服务部署时 目前ELK支持 7.12.x - 7.15.x
# 下载地址
中文官网地址:https://www.elastic.co/cn/
中文分词插件:https://github.com/infinilabs/analysis-ik/releases 或 https://release.infinilabs.com/analysis-ik/
历史版本下载地址:https://www.elastic.co/cn/downloads/past-releases
ELK下载地址 https://www.elastic.co/cn/downloads/elasticsearch https://www.elastic.co/cn/downloads/logstash https://www.elastic.co/cn/downloads/kibana
官方部署文档 https://www.elastic.co/guide/cn/elasticsearch/guide/current/deploy.html
注意:安装中文分词插件时,务必对应 Elasticsearch 的版本号。
# 单机部署
# elasticsearch
echo 'vm.max_map_count=262144' >> /etc/sysctl.conf
sysctl -p

cat >> /etc/security/limits.conf << 'EOF'
* soft nofile 65535
* hard nofile 65535
EOF

# 主机名映射
echo '192.168.100.177 cop-elk' /etc/hosts

# 创建数据目录 务必注意目录权限和属主
mkdir -p /data/elasticsearch/{data,logs}
chown -R elasticsearch:elasticsearch /data/elasticsearch

# 安装elk
list=(elasticsearch-8.9.0-x86_64.rpm kibana-8.9.0-x86_64.rpm logstash-8.9.0-x86_64.rpm)
for x in "${list[@]}"; do rpm -ivh "${x}"; done

# 安装中文分词插件-ik
mkdir -p /usr/share/elasticsearch/plugins/ik
unzip elasticsearch-analysis-ik-8.9.0.zip -d /usr/share/elasticsearch/plugins/ik
vim /etc/elasticsearch/elasticsearch.yml
# ======================== Elasticsearch Configuration =========================
#
# NOTE: Elasticsearch comes with reasonable defaults for most settings.
#       Before you set out to tweak and tune the configuration, make sure you
#       understand what are you trying to accomplish and the consequences.
#
# The primary way of configuring a node is via this file. This template lists
# the most important settings you may want to configure for a production cluster.
#
# Please consult the documentation for further information on configuration options:
# https://www.elastic.co/guide/en/elasticsearch/reference/index.html
#
# ---------------------------------- Cluster -----------------------------------
#
# Use a descriptive name for your cluster:
#
cluster.name: es
#
# ------------------------------------ Node ------------------------------------
#
# Use a descriptive name for the node:
#
node.name: node-1
#
# Add custom attributes to the node:
#
#node.attr.rack: r1
#
# ----------------------------------- Paths ------------------------------------
#
# Path to directory where to store the data (separate multiple locations by comma):
#
path.data: /data/elasticsearch/data
#
# Path to log files:
#
path.logs: /data/elasticsearch/logs
#
# ----------------------------------- Memory -----------------------------------
#
# Lock the memory on startup:
#
#bootstrap.memory_lock: true
#
# Make sure that the heap size is set to about half the memory available
# on the system and that the owner of the process is allowed to use this
# limit.
#
# Elasticsearch performs poorly when the system is swapping the memory.
#
# ---------------------------------- Network -----------------------------------
#
# By default Elasticsearch is only accessible on localhost. Set a different
# address here to expose this node on the network:
#
network.host: 172.20.20.71
#
# By default Elasticsearch listens for HTTP traffic on the first free port it
# finds starting at 9200. Set a specific HTTP port here:
#
http.port: 9200
#
# For more information, consult the network module documentation.
#
# --------------------------------- Discovery ----------------------------------
#
# Pass an initial list of hosts to perform discovery when this node is started:
# The default list of hosts is ["127.0.0.1", "[::1]"]
#
discovery.seed_hosts: ["172.20.20.71"]
#
# Bootstrap the cluster using an initial set of master-eligible nodes:
#
cluster.initial_master_nodes: ["node-1"]
#
# For more information, consult the discovery and cluster formation module documentation.
#
# ---------------------------------- Various -----------------------------------
#
# Allow wildcard deletion of indices:
#
#action.destructive_requires_name: false

#----------------------- BEGIN SECURITY AUTO CONFIGURATION -----------------------
#
# The following settings, TLS certificates, and keys have been automatically
# generated to configure Elasticsearch security features on 23-10-2023 21:17:45
#
# --------------------------------------------------------------------------------

# Enable security features
# xpack.security.enabled: true
xpack.security.enabled: false

xpack.security.enrollment.enabled: true

# Enable encryption for HTTP API client connections, such as Kibana, Logstash, and Agents
xpack.security.http.ssl:
  enabled: true
  keystore.path: certs/http.p12

# Enable encryption and mutual authentication between cluster nodes
xpack.security.transport.ssl:
  enabled: true
  verification_mode: certificate
  keystore.path: certs/transport.p12
  truststore.path: certs/transport.p12
# Create a new cluster with the current node only
# Additional nodes can still join the cluster later
# cluster.initial_master_nodes: ["es-1"]

# Allow HTTP API connections from anywhere
# Connections are encrypted and require user authentication
http.host: 0.0.0.0

# Allow other nodes to join the cluster from anywhere
# Connections are encrypted and mutually authenticated
transport.host: 0.0.0.0
transport.port: 9300

http.cors.enabled: true
http.cors.allow-origin: "*"

#----------------------- END SECURITY AUTO CONFIGURATION -------------------------
# 重启服务
systemctl restart elasticsearch

# 创建集群令牌
/usr/share/elasticsearch/bin/elasticsearch-create-enrollment-token -s node

# 其余节点添加集群令牌
/usr/share/elasticsearch/bin/elasticsearch-reconfigure-node --enrollment-token ss -tlnp |egrep ":9200|:9300"

# 以下命令关闭xpack安全功能
sed -i 's?xpack.security.enabled: .*?xpack.security.enabled: false?' /etc/elasticsearch/elasticsearch.yml
Elasticsearch(ES)在开启HTTPS后,默认的账号和密码是elastic和changeme。重置为随机密码命令为:
echo y | elasticsearch-reset-password -a -u elastic
在Elasticsearch 7.x版本及之后,默认的用户凭证通常是elastic作为用户名,密码则是在安装时自动生成的一个随机密码。这个随机密码在安装日志中通常会有显示,或者可以在安装后的Elasticsearch配置文件中找到。以下是安装完成时的输出提示:
Authentication and authorization are enabled.
TLS for the transport and HTTP layers is enabled and configured.

The generated password for the elastic built-in superuser is : 4amkgdjNJAOilEWzP-9p

If this node should join an existing cluster, you can reconfigure this with
'/usr/share/elasticsearch/bin/elasticsearch-reconfigure-node --enrollment-token <token-here>'
after creating an enrollment token on your existing cluster.

You can complete the following actions at any time:

Reset the password of the elastic built-in superuser with
'/usr/share/elasticsearch/bin/elasticsearch-reset-password -u elastic'.

Generate an enrollment token for Kibana instances with
 '/usr/share/elasticsearch/bin/elasticsearch-create-enrollment-token -s kibana'.

Generate an enrollment token for Elasticsearch nodes with
'/usr/share/elasticsearch/bin/elasticsearch-create-enrollment-token -s node'.
# 检查服务是否OK 由于默认开启了https 所以要带上 https:// 网上都不带协议 TMD的鬼扯
curl -vkL -X GET "https://localhost:9200" -H "Expect:" -u elastic:Z+2VlqW-_sudV+o9hEx9
# 检查节点健康状态 "status":"green" 则OK
curl -vkL -X GET "https://localhost:9200/_cluster/health" -H "Expect:" -u elastic:Z+2VlqW-_sudV+o9hEx9
curl -X GET "http://localhost:9200/_cat/nodes?v" -H "Expect:" -u elastic:Z+2VlqW-_sudV+o9hEx9

# 浏览器打开连接进行测试
# 未开启安全连接使用 http://172.20.20.71:9200
# 已开启安全连接使用 https://172.20.20.71:9200

# 集群监控
# http://172.20.20.71:9200/_cluster/health?pretty
# 集群状态
# http://172.20.20.71:9200/_cluster/state?pretty

# 浏览器免弹窗登录
# https://elastic:changeme@192.168.100.171:9200

# http://192.168.100.171:9200/_cat/nodes?v
#联网下载并安装
wget https://artifacts.elastic.co/downloads/elasticsearch/elasticsearch-8.12.2-x86_64.rpm
wget https://artifacts.elastic.co/downloads/elasticsearch/elasticsearch-8.12.2-x86_64.rpm.sha512
sha512sum -c elasticsearch-8.12.2-x86_64.rpm.sha512
rpm --install elasticsearch-8.12.2-x86_64.rpm

证书生成工具
elasticsearch-certgen
这种方式如果以后新增节点导致证书得重新生成并放到es所有节点

elasticsearch-certutil
/usr/share/elasticsearch/bin/elasticsearch-certutil ca
/usr/share/elasticsearch/bin/elasticsearch-certutil cert --ca elastic-stack-ca.p12
# logstash
rpm -ivh logstash-8.10.2-x86_64.rpm kibana-8.10.2-x86_64.rpm
mkdir -p /data/logstash/{data,logs}
chown -R logstash:logstash /data/logstash

vim /etc/logstash/logstash.yml
path.data: /data/logstash/data
path.logs: /data/logstash/logs

vim config/input-output.conf
# 修改内容
input {
  tcp {
    mode => "server"
    host => "0.0.0.0"
    port => 9060
    codec => json_lines
  }
}
filter {
}
output {
  elasticsearch {
    hosts => ["172.20.20.71:9200"]
    index => "logstash-%{+YYYY.MM.dd}"
  }
}

systemctl restart logstash
systemctl status logstash
systemctl enable logstash
# kibana
mkdir -p /data/kibana/{data,logs}
chown -R kibana:kibana /data/kibana

grep -n 'server.host' /etc/kibana/kibana.yml

ipAddr="$(ip addr | grep -Eo '([0-9]{1,3}\.){3}[0-9]{1,3}' | grep -v '127.0.0' | grep -v '.255' | head -1)"
sed -i "s%#server.host: \"localhost\"%server.host: \"${ipAddr}\"%" /etc/kibana/kibana.yml

grep -n 'elasticsearch' /etc/kibana/kibana.yml

vim /etc/kibana/kibana.yml
i18n.locale: "zh-CN"
server.port: 5601
server.host: "172.20.20.71"
elasticsearch.hosts: ["http://172.20.20.71:9200"]
# elasticsearch.username: "kibana_system"
# elasticsearch.password: "i4Seeyon"
path.data: /data/kibana/data
fileName: /data/kibana/logs/kibana.log

systemctl restart kibana
systemctl status kibana
systemctl enable kibana

# 浏览器访问
http://172.20.20.71:5601
scp /etc/elasticsearch/certs/http.p12 root@192.168.100.175:/etc/kibana/certs/

以下是通常的步骤和可能需要设置的参数(具体取决于Kibana版本):

提取证书和私钥(如果Kibana不支持直接使用.p12文件):
你可以使用OpenSSL等工具从.p12文件中提取证书和私钥。例如:

bash
openssl pkcs12 -in http.p12 -nocerts -nodes -out private_key.pem
openssl pkcs12 -in http.p12 -clcerts -nokeys -out certificate.pem
这将生成private_key.pem(私钥文件)和certificate.pem(证书文件)。

配置Kibana以使用证书和私钥:
在你的kibana.yml配置文件中,你可能需要设置类似于以下的参数:

yaml
elasticsearch.hosts: ["https://your_elasticsearch_host:9200"]
elasticsearch.ssl.certificateAuthorities: ["/path/to/certificate.pem"] # 证书文件的路径
elasticsearch.ssl.key: ["/path/to/private_key.pem"] # 私钥文件的路径
elasticsearch.ssl.certificate: ["/path/to/certificate.pem"] # 如果有必要,指定证书文件的路径
请注意,这些参数的确切名称和可用性可能因Kibana版本而异。务必查阅你所使用的Kibana版本的官方文档,以了解如何正确配置SSL/TLS。

重启Kibana:
完成配置后,重启Kibana服务以使配置生效。

如果你的Kibana版本支持直接使用.p12文件,那么你可能只需要指定包含.p12文件的路径,而不需要进行上述的证书和私钥提取步骤。然而,这种情况并不常见,因为PEM格式是更广泛接受和使用的证书格式。
# 集群部署
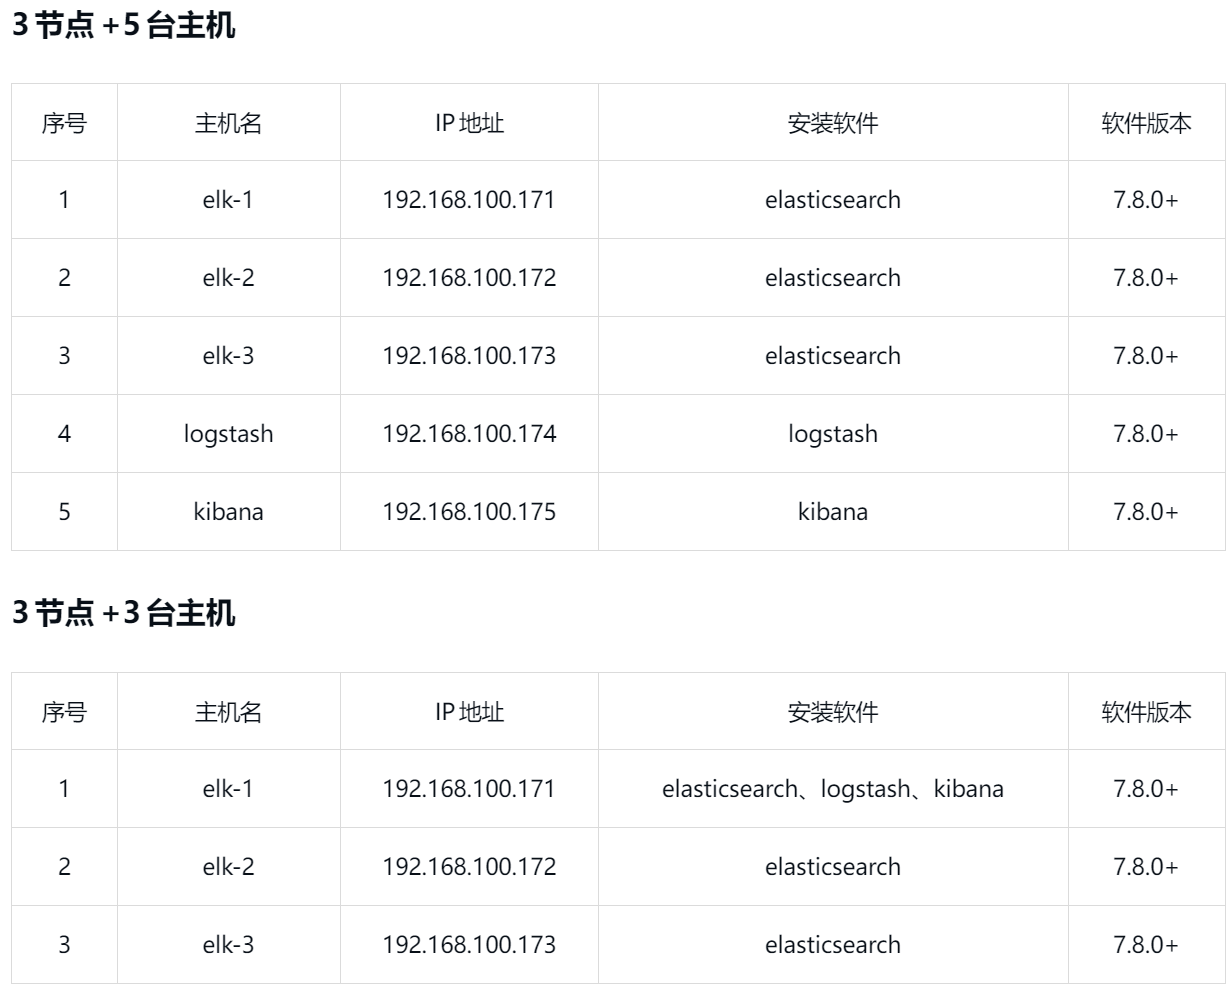
# 节点说明
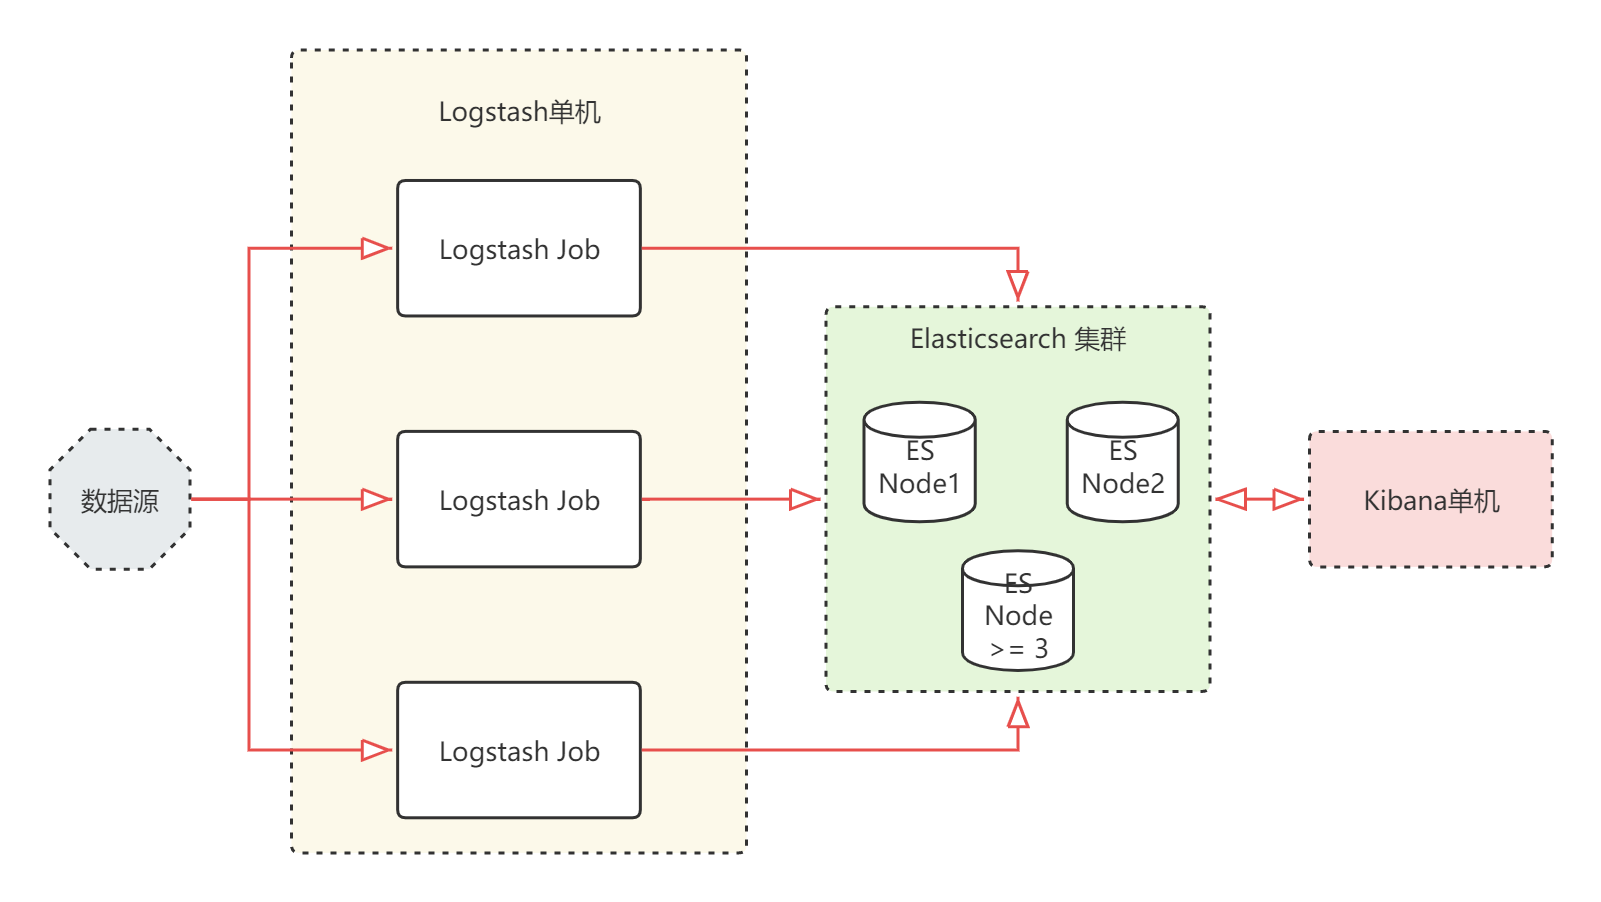
3个节点的集群。建议5台服务器进行部署。es集群占用3台,logstash 和 kibana 分别独占一台。 如果是 COP-V8 使用,建议使用 8.9.0 以上的版本,注意分词插件匹配对应的 ES 版本。 老版本需要优化系统参数,新版本使用 rpm/deb 进行部署时,好像会自动优化。此步骤可省略。
# 拓扑结构
echo 'vm.max_map_count=262144' >> /etc/sysctl.conf
sysctl -p

# limit 优化
ulimit -SHn 65535

cat >> /etc/security/limits.conf <<="" code="">
# 主机名映射
# sed -i '/^192.168.100.17/d' /etc/hosts
# sed -i '/^0.0.0.0/d' /etc/hosts
cat >> /etc/hosts << 'EOF'
192.168.100.177 v8-elk-1
192.168.100.178 v8-elk-2
192.168.100.179 v8-elk-3
EOF
官网网地址:https://www.elastic.co/cn/ 官方下载:https://www.elastic.co/cn/downloads/
# 使用二进制文件安装
# 提前下载以下3个文件并上传到所有集群节点服务器上
# elasticsearch-8.9.0-linux-x86_64.tar.gz
# logstash-8.9.0-linux-x86_64.tar.gz
# kibana-8.9.0-linux-x86_64.tar.gz

mkdir -p /apps
tar -xf elasticsearch-8.9.0-linux-x86_64.tar.gz -C /apps
tar -xf logstash-8.9.0-linux-x86_64.tar.gz -C /apps
tar -xf kibana-8.9.0-linux-x86_64.tar.gz -C /apps

mv /apps/elasticsearch-8.9.0 /apps/elasticsearch
mv /apps/logstash-8.9.0 /apps/logstash
mv /apps/kibana-8.9.0 /apps/kibana

echo 'export PATH=/apps/elasticsearch/bin:$PATH' >> /etc/profile
echo 'export PATH=/apps/logstash/bin:$PATH' >> /etc/profile
echo 'export PATH=/apps/kibana/bin:$PATH' >> /etc/profile

# 使用自选版本的 openjdk 否则使用安装包自带的 openjdk
# OpenJDK11U-jdk_x64_linux_11.0.16_8.tar.gz
tar -xf OpenJDK11U-jdk_x64_linux_11.0.16_8.tar.gz -C /apps
mv /apps/openjdk-11.0.16_8 /apps/openjdk
echo 'export JAVA_HOME=/apps/openjdk' >> /etc/profile
echo 'export PATH=$JAVA_HOME/bin:$PATH' >> /etc/profile

source /etc/profile

cat > /etc/systemd/system/elasticsearch.service << 'EOF'
[Unit]
Description=Elasticsearch
Documentation=https://www.elastic.co
Wants=network-online.target
After=network-online.target

[Service]
Type=notify
# the elasticsearch process currently sends the notifications back to systemd
# and for some reason exec does not work (even though it is a child). We should change
# this notify access back to main (the default), see https://github.com/elastic/elasticsearch/issues/86475
NotifyAccess=all
RuntimeDirectory=elasticsearch
PrivateTmp=true
Environment=ES_HOME=/usr/share/elasticsearch
Environment=ES_PATH_CONF=/etc/elasticsearch
Environment=PID_DIR=/var/run/elasticsearch
Environment=ES_SD_NOTIFY=true
EnvironmentFile=-/etc/sysconfig/elasticsearch

WorkingDirectory=/usr/share/elasticsearch

User=elasticsearch
Group=elasticsearch

ExecStart=/usr/share/elasticsearch/bin/systemd-entrypoint -p ${PID_DIR}/elasticsearch.pid --quiet

# StandardOutput is configured to redirect to journalctl since
# some error messages may be logged in standard output before
# elasticsearch logging system is initialized. Elasticsearch
# stores its logs in /var/log/elasticsearch and does not use
# journalctl by default. If you also want to enable journalctl
# logging, you can simply remove the "quiet" option from ExecStart.
StandardOutput=journal
StandardError=inherit

# Specifies the maximum file descriptor number that can be opened by this process
LimitNOFILE=65535

# Specifies the maximum number of processes
LimitNPROC=4096

# Specifies the maximum size of virtual memory
LimitAS=infinity

# Specifies the maximum file size
LimitFSIZE=infinity

# Disable timeout logic and wait until process is stopped
TimeoutStopSec=0

# SIGTERM signal is used to stop the Java process
KillSignal=SIGTERM

# Send the signal only to the JVM rather than its control group
KillMode=process

# Java process is never killed
SendSIGKILL=no

# When a JVM receives a SIGTERM signal it exits with code 143
SuccessExitStatus=143

# Allow a slow startup before the systemd notifier module kicks in to extend the timeout
TimeoutStartSec=900

[Install]
WantedBy=multi-user.target

# Built for packages-8.10.2 (packages)
EOF
# 使用 RPM 文件安装
# 在线安装
# 官方
cat > /etc/yum.repos.d/elasticsearch.repo << 'EOF'
[elasticsearch]
name=Elasticsearch repository for 8.x packages
baseurl=https://artifacts.elastic.co/packages/8.x/yum
gpgcheck=1
gpgkey=https://artifacts.elastic.co/GPG-KEY-elasticsearch
enabled=0
autorefresh=1
type=rpm-md
EOF

rpm --import https://artifacts.elastic.co/GPG-KEY-elasticsearch
yum install --enablerepo=elasticsearch elasticsearch

# 本地的局域网更新源
cat > /etc/yum.repos.d/elasticstack.repo << 'EOF'
[elasticstack]
name=Elasticsearch repository for 8.x packages
baseurl=https://repos.oso.plus/elasticstack/8.x/yum
gpgcheck=0
gpgkey=https://repos.oso.plus/elasticstack/GPG-KEY-elasticsearch
enabled=1
autorefresh=0
type=rpm-md
EOF

# 以下命令将安装最新版
dnf install elasticsearch logstash kibana
# 离线安装
# 不使用自带的 jdk 时,记得先安装 openjdk 或 jdk
# dnf install -y java-17-openjdk

# 可在文件 /usr/share/elasticsearch/bin/elasticsearch-env 中设置 JDK 参数
# 可在文件 /usr/share/elasticsearch/bin/jvm.options 中设置 JVM 等参数

# wget https://artifacts.elastic.co/downloads/elasticsearch/elasticsearch-8.9.0-x86_64.rpm
# wget https://artifacts.elastic.co/downloads/elasticsearch/elasticsearch-8.9.0-x86_64.rpm.sha512
# shasum -a 512 -c elasticsearch-8.9.0-x86_64.rpm.sha512
rpm -ivh elasticsearch-8.9.0-x86_64.rpm

# 8.9.0
list=(elasticsearch-8.9.0-x86_64.rpm logstash-8.9.0-x86_64.rpm kibana-8.9.0-x86_64.rpm)
for x in "${list[@]}"; do rpm -ivh "${x}"; done

# 如果使用 NFS 共享挂载盘 记得在 /etc/fstab 中配置开机自动挂载
# 192.168.100.254:/volume3/k8s/elasticsearch /data/elasticsearch nfs defaults,_netdev 0 0

# 创建数据目录 务必注意目录权限和属主 二进制安装需要分别手动创建ELK的系统帐户 RPM安装后 需要手动创建数据目录并且调整属主
mkdir -p /data/elasticsearch/{data,logs}
chown -R elasticsearch:elasticsearch /data/elasticsearch

# 配置文件 /etc/elasticsearch/elasticsearch.yml

# 设置开机自启
systemctl daemon-reload
systemctl enable elasticsearch

# 启动并查看服务
systemctl start elasticsearch
systemctl status elasticsearch

# 如有必要则添加环境变量 我这里把 ELK 的三个软件一起添加了
echo 'export PATH=/usr/share/elasticsearch/bin:/usr/share/kibana/bin:/usr/share/logstash/bin:$PATH' >> /etc/profile
source /etc/profile
# 安装和配置 elasticsearch
# 调整文件配置
目标文件:/etc/elasticsearch/elasticsearch.yml
# ES 的配置目录
| 配置类型 | 描述 | 路径 |
|---|---|---|
| home | elasticsearch的home目录 | /usr/share/elasticsearch |
| bin | elasticsearch的bin目录 | /usr/share/elasticsearch/bin |
| conf | elasticsearch的配置文件 | /etc/elasticsearch |
| conf | elasticsearch的环境变量配置 | /etc/sysconfig/elasticsearch |
| data | elasticsearch的数据目录 | /var/lib/elasticsearch |
| logs | elasticsearch的日志目录 | /var/log/elasticsearch |
| plugins | elasticsearch的插件目录 | /usr/share/elasticsearch/plugins |
# ES 的配置文件
elasticsearch.yml 用于配置 Elasticsearch
jvm.options 用于配置 Elasticsearch JVM 设置
log4j.properties 用于配置 Elasticsearch 日志记录
# 使用命令修改
按需调整相关变量参数后,复制以下的所有 shell 命令,直接粘贴到终端后回车。
clusterName="es-elk-cluster"
nodeName="$(hostname)"
pathData="/data/elasticsearch/data"
pathLogs="/data/elasticsearch/logs"
networkHost="$(ip addr | grep -Po '(?<=inet ).*(?=\/)' | grep -Ev '127.0.0|0.0.0' | head -1)"
httpPort="9200"
discoverySeedHosts="[\"192.168.100.177\", \"192.168.100.178\", \"192.168.100.179\"]"
clusterInitialMasterNodes="[\"${nodeName}\", \"${nodeName}\", \"${nodeName}\"]"
xpackSecurityEnabled="false"
httpHost="0.0.0.0"
transportHost="0.0.0.0"
transportPort="9300"
httpCorsEnabled="true"
httpCorsAllowOrigin="\"*\""

sed -i "s%^#cluster.name:.*%cluster.name: ${clusterName}%" /etc/elasticsearch/elasticsearch.yml
sed -i "s%^#node.name:.*%node.name: ${nodeName}%" /etc/elasticsearch/elasticsearch.yml
sed -i "s%^path.data:.*%path.data: ${pathData}%" /etc/elasticsearch/elasticsearch.yml
sed -i "s%^path.logs:.*%path.logs: ${pathLogs}%" /etc/elasticsearch/elasticsearch.yml
sed -i "s%^#network.host:.*%network.host: ${networkHost}%" /etc/elasticsearch/elasticsearch.yml
sed -i "s%^#http.port:.*%http.port: ${httpPort}%" /etc/elasticsearch/elasticsearch.yml
sed -i "s%^#discovery.seed_hosts:.*%discovery.seed_hosts: ${discoverySeedHosts}%" /etc/elasticsearch/elasticsearch.yml
sed -i "s%^cluster.initial_master_nodes:.*%cluster.initial_master_nodes: ${clusterInitialMasterNodes}%" /etc/elasticsearch/elasticsearch.yml
sed -i "s%^xpack.security.enabled:.*%xpack.security.enabled: ${xpackSecurityEnabled}%" /etc/elasticsearch/elasticsearch.yml
sed -i "s%^http.host:.*%http.host: ${httpHost}%" /etc/elasticsearch/elasticsearch.yml
sed -i "s%^#transport.host:.*%transport.host: ${transportHost}%" /etc/elasticsearch/elasticsearch.yml
{
echo "transport.port: ${transportPort}"
echo "http.cors.enabled: ${httpCorsEnabled}"
echo "http.cors.allow-origin: ${httpCorsAllowOrigin}"
} >> /etc/elasticsearch/elasticsearch.yml
# 人工手动修改
# 修改 node.name: es-1 为对应的节点名之外
# 修改 network.host: 192.168.100.177 的IP为对应节点所在IP地址
# sed -i "s/^network.host.*/network.host: $(ip addr | grep -Po '(?<=inet ).*(?=\/)' | grep -Ev '127.0.0|0.0.0' | head -1)" /etc/elasticsearch/elasticsearch.yml
cat /etc/elasticsearch/elasticsearch.yml
# v8-elk-1 的 elasticsearch.yml
# ======================== Elasticsearch Configuration =========================
#
# NOTE: Elasticsearch comes with reasonable defaults for most settings.
#       Before you set out to tweak and tune the configuration, make sure you
#       understand what are you trying to accomplish and the consequences.
#
# The primary way of configuring a node is via this file. This template lists
# the most important settings you may want to configure for a production cluster.
#
# Please consult the documentation for further information on configuration options:
# https://www.elastic.co/guide/en/elasticsearch/reference/index.html
#
# ---------------------------------- Cluster -----------------------------------
#
# Use a descriptive name for your cluster:
#
cluster.name: v8-elk-cluster
#
# ------------------------------------ Node ------------------------------------
#
# Use a descriptive name for the node:
#
node.name: v8-elk-1
#
# Add custom attributes to the node:
#
#node.attr.rack: r1
#
# ----------------------------------- Paths ------------------------------------
#
# Path to directory where to store the data (separate multiple locations by comma):
#
path.data: /data/elasticsearch/data
#
# Path to log files:
#
path.logs: /data/elasticsearch/logs
#
# ----------------------------------- Memory -----------------------------------
#
# Lock the memory on startup:
#
#bootstrap.memory_lock: true
#
# Make sure that the heap size is set to about half the memory available
# on the system and that the owner of the process is allowed to use this
# limit.
#
# Elasticsearch performs poorly when the system is swapping the memory.
#
# ---------------------------------- Network -----------------------------------
#
# By default Elasticsearch is only accessible on localhost. Set a different
# address here to expose this node on the network:
#
network.host: 192.168.100.177
#
# By default Elasticsearch listens for HTTP traffic on the first free port it
# finds starting at 9200. Set a specific HTTP port here:
#
http.port: 9200
#
# For more information, consult the network module documentation.
#
# --------------------------------- Discovery ----------------------------------
#
# Pass an initial list of hosts to perform discovery when this node is started:
# The default list of hosts is ["127.0.0.1", "[::1]"]
#
discovery.seed_hosts: ["192.168.100.177", "192.168.100.178", "192.168.100.179"]
#
# Bootstrap the cluster using an initial set of master-eligible nodes:
#
#cluster.initial_master_nodes: ["node-1", "node-2"]
#
# For more information, consult the discovery and cluster formation module documentation.
#
# ---------------------------------- Various -----------------------------------
#
# Allow wildcard deletion of indices:
#
#action.destructive_requires_name: false

#----------------------- BEGIN SECURITY AUTO CONFIGURATION -----------------------
#
# The following settings, TLS certificates, and keys have been automatically
# generated to configure Elasticsearch security features on 05-11-2023 04:19:25
#
# --------------------------------------------------------------------------------

# Enable security features
xpack.security.enabled: false

xpack.security.enrollment.enabled: true

# Enable encryption for HTTP API client connections, such as Kibana, Logstash, and Agents
xpack.security.http.ssl:
  enabled: true
  keystore.path: certs/http.p12

# Enable encryption and mutual authentication between cluster nodes
xpack.security.transport.ssl:
  enabled: true
  verification_mode: certificate
  keystore.path: certs/transport.p12
  truststore.path: certs/transport.p12

xpack.monitoring.elasticsearch.collection.enabled: true

# Create a new cluster with the current node only
# Additional nodes can still join the cluster later
cluster.initial_master_nodes: ["v8-elk-1", "v8-elk-2", "v8-elk-3"]

# Allow HTTP API connections from anywhere
# Connections are encrypted and require user authentication
http.host: 0.0.0.0

# Allow other nodes to join the cluster from anywhere
# Connections are encrypted and mutually authenticated
transport.host: 0.0.0.0

#----------------------- END SECURITY AUTO CONFIGURATION -------------------------
transport.port: 9300
http.cors.enabled: true
http.cors.allow-origin: "*"
# v8-elk-2 的 elasticsearch.yml
# ======================== Elasticsearch Configuration =========================
#
# NOTE: Elasticsearch comes with reasonable defaults for most settings.
#       Before you set out to tweak and tune the configuration, make sure you
#       understand what are you trying to accomplish and the consequences.
#
# The primary way of configuring a node is via this file. This template lists
# the most important settings you may want to configure for a production cluster.
#
# Please consult the documentation for further information on configuration options:
# https://www.elastic.co/guide/en/elasticsearch/reference/index.html
#
# ---------------------------------- Cluster -----------------------------------
#
# Use a descriptive name for your cluster:
#
cluster.name: v8-elk-cluster
#
# ------------------------------------ Node ------------------------------------
#
# Use a descriptive name for the node:
#
node.name: v8-elk-2
#
# Add custom attributes to the node:
#
#node.attr.rack: r1
#
# ----------------------------------- Paths ------------------------------------
#
# Path to directory where to store the data (separate multiple locations by comma):
#
path.data: /data/elasticsearch/data
#
# Path to log files:
#
path.logs: /data/elasticsearch/logs
#
# ----------------------------------- Memory -----------------------------------
#
# Lock the memory on startup:
#
#bootstrap.memory_lock: true
#
# Make sure that the heap size is set to about half the memory available
# on the system and that the owner of the process is allowed to use this
# limit.
#
# Elasticsearch performs poorly when the system is swapping the memory.
#
# ---------------------------------- Network -----------------------------------
#
# By default Elasticsearch is only accessible on localhost. Set a different
# address here to expose this node on the network:
#
network.host: 192.168.100.178
#
# By default Elasticsearch listens for HTTP traffic on the first free port it
# finds starting at 9200. Set a specific HTTP port here:
#
http.port: 9200
#
# For more information, consult the network module documentation.
#
# --------------------------------- Discovery ----------------------------------
#
# Pass an initial list of hosts to perform discovery when this node is started:
# The default list of hosts is ["127.0.0.1", "[::1]"]
#
discovery.seed_hosts: ["192.168.100.177", "192.168.100.178", "192.168.100.179"]
#
# Bootstrap the cluster using an initial set of master-eligible nodes:
#
#cluster.initial_master_nodes: ["node-1", "node-2"]
#
# For more information, consult the discovery and cluster formation module documentation.
#
# ---------------------------------- Various -----------------------------------
#
# Allow wildcard deletion of indices:
#
#action.destructive_requires_name: false

#----------------------- BEGIN SECURITY AUTO CONFIGURATION -----------------------
#
# The following settings, TLS certificates, and keys have been automatically
# generated to configure Elasticsearch security features on 05-11-2023 04:19:25
#
# --------------------------------------------------------------------------------

# Enable security features
xpack.security.enabled: false

xpack.security.enrollment.enabled: true

# Enable encryption for HTTP API client connections, such as Kibana, Logstash, and Agents
xpack.security.http.ssl:
  enabled: true
  keystore.path: certs/http.p12

# Enable encryption and mutual authentication between cluster nodes
xpack.security.transport.ssl:
  enabled: true
  verification_mode: certificate
  keystore.path: certs/transport.p12
  truststore.path: certs/transport.p12

xpack.monitoring.elasticsearch.collection.enabled: true

# Create a new cluster with the current node only
# Additional nodes can still join the cluster later
cluster.initial_master_nodes: ["v8-elk-1", "v8-elk-2", "v8-elk-3"]

# Allow HTTP API connections from anywhere
# Connections are encrypted and require user authentication
http.host: 0.0.0.0

# Allow other nodes to join the cluster from anywhere
# Connections are encrypted and mutually authenticated
transport.host: 0.0.0.0

#----------------------- END SECURITY AUTO CONFIGURATION -------------------------
transport.port: 9300
http.cors.enabled: true
http.cors.allow-origin: "*"
# v8-elk-3 的 elasticsearch.yml
# ======================== Elasticsearch Configuration =========================
#
# NOTE: Elasticsearch comes with reasonable defaults for most settings.
#       Before you set out to tweak and tune the configuration, make sure you
#       understand what are you trying to accomplish and the consequences.
#
# The primary way of configuring a node is via this file. This template lists
# the most important settings you may want to configure for a production cluster.
#
# Please consult the documentation for further information on configuration options:
# https://www.elastic.co/guide/en/elasticsearch/reference/index.html
#
# ---------------------------------- Cluster -----------------------------------
#
# Use a descriptive name for your cluster:
#
cluster.name: v8-elk-cluster
#
# ------------------------------------ Node ------------------------------------
#
# Use a descriptive name for the node:
#
node.name: v8-elk-3
#
# Add custom attributes to the node:
#
#node.attr.rack: r1
#
# ----------------------------------- Paths ------------------------------------
#
# Path to directory where to store the data (separate multiple locations by comma):
#
path.data: /data/elasticsearch/data
#
# Path to log files:
#
path.logs: /data/elasticsearch/logs
#
# ----------------------------------- Memory -----------------------------------
#
# Lock the memory on startup:
#
#bootstrap.memory_lock: true
#
# Make sure that the heap size is set to about half the memory available
# on the system and that the owner of the process is allowed to use this
# limit.
#
# Elasticsearch performs poorly when the system is swapping the memory.
#
# ---------------------------------- Network -----------------------------------
#
# By default Elasticsearch is only accessible on localhost. Set a different
# address here to expose this node on the network:
#
network.host: 192.168.100.179
#
# By default Elasticsearch listens for HTTP traffic on the first free port it
# finds starting at 9200. Set a specific HTTP port here:
#
http.port: 9200
#
# For more information, consult the network module documentation.
#
# --------------------------------- Discovery ----------------------------------
#
# Pass an initial list of hosts to perform discovery when this node is started:
# The default list of hosts is ["127.0.0.1", "[::1]"]
#
discovery.seed_hosts: ["192.168.100.177", "192.168.100.178", "192.168.100.179"]
#
# Bootstrap the cluster using an initial set of master-eligible nodes:
#
#cluster.initial_master_nodes: ["node-1", "node-2"]
#
# For more information, consult the discovery and cluster formation module documentation.
#
# ---------------------------------- Various -----------------------------------
#
# Allow wildcard deletion of indices:
#
#action.destructive_requires_name: false

#----------------------- BEGIN SECURITY AUTO CONFIGURATION -----------------------
#
# The following settings, TLS certificates, and keys have been automatically
# generated to configure Elasticsearch security features on 05-11-2023 04:19:24
#
# --------------------------------------------------------------------------------

# Enable security features
xpack.security.enabled: false

xpack.security.enrollment.enabled: true

# Enable encryption for HTTP API client connections, such as Kibana, Logstash, and Agents
xpack.security.http.ssl:
  enabled: true
  keystore.path: certs/http.p12

# Enable encryption and mutual authentication between cluster nodes
xpack.security.transport.ssl:
  enabled: true
  verification_mode: certificate
  keystore.path: certs/transport.p12
  truststore.path: certs/transport.p12

xpack.monitoring.elasticsearch.collection.enabled: true

# Create a new cluster with the current node only
# Additional nodes can still join the cluster later
cluster.initial_master_nodes: ["v8-elk-1", "v8-elk-2", "v8-elk-3"]

# Allow HTTP API connections from anywhere
# Connections are encrypted and require user authentication
http.host: 0.0.0.0

# Allow other nodes to join the cluster from anywhere
# Connections are encrypted and mutually authenticated
transport.host: 0.0.0.0

#----------------------- END SECURITY AUTO CONFIGURATION -------------------------
transport.port: 9300
http.cors.enabled: true
http.cors.allow-origin: "*"
# 创建集群令牌
/usr/share/elasticsearch/bin/elasticsearch-create-enrollment-token -s node
# 其余节点添加集群令牌
/usr/share/elasticsearch/bin/elasticsearch-reconfigure-node --enrollment-token
当 xpack.security.enabled: true 时,我这里加入集群没成功,日志报错是证书问题。暂时懒得去折腾了,所以直接设置为 false 了。 https://blog.csdn.net/github_30641423/article/details/123746349
# /usr/share/elasticsearch/bin/elasticsearch-certutilsystemctl start elasticsearch
systemctl restart elasticsearch
systemctl enable elasticsearch
systemctl stop elasticsearch
systemctl status elasticsearch

ss -tlnp |egrep ":9200|:9300"
# 检查服务是否OK 由于默认开启了https 所以要带上 https:// 网上都不带协议 TMD的鬼扯
curl -vkL -X GET "https://localhost:9200" -H "Expect:" -u elastic:Z+2VlqW-_sudV+o9hEx9
# 检查节点健康状态 "status":"green" 则OK
curl -vkL -X GET "https://localhost:9200/_cluster/health" -H "Expect:" -u elastic:Z+2VlqW-_sudV+o9hEx9
# 节点状态
curl -X GET "http://localhost:9200/_cat/nodes?v" -H "Expect:" -u elastic:Z+2VlqW-_sudV+o9hEx9

# 浏览器打开连接进行测试
# 未开启安全连接使用 http://192.168.100.177:9200
# 已开启安全连接使用 https://192.168.100.177:9200

# 集群监控
# http://192.168.100.179:9200/_cluster/health?pretty
# 集群状态
# http://192.168.100.179:9200/_cluster/state?pretty
# 节点状态
# http://192.168.100.179:9200/_cat/nodes?v
# 安装 head 插件 - 可选
# 所有节点 - 需要联网
yum install -y git npm
git clone git://github.com/mobz/elasticsearch-head.git
cd elasticsearch-head/
npm install
npm run start
# 安装 analysis-ik 插件 - 必需
分词插件需要注意版本匹配
# https://github.com/medcl/elasticsearch-analysis-ik/releases
# wget https://github.com/medcl/elasticsearch-analysis-ik/releases/download/v8.9.0/elasticsearch-analysis-ik-8.9.0.zip

# 离线安装
# cd /usr/share/elasticsearch && elasticsearch-plugin install file:///path/to/elasticsearch-analysis-ik-8.9.0.zip

# 创建插件目录并解压
mkdir -p /usr/share/elasticsearch/plugins/ik
unzip elasticsearch-analysis-ik-8.9.0.zip -d /usr/share/elasticsearch/plugins/ik

# 在线安装
elasticsearch-plugin install https://github.com/medcl/elasticsearch-analysis-ik/releases/download/v8.9.0/elasticsearch-analysis-ik-8.9.0.zip

# 使用 IP 验证分词效果
curl -H "Content-Type: application/json" -XPOST 'http://192.168.100.177:9200/_analyze?pretty' -d '{"text":"我们是致远人"}'
# 使用 经过负载均衡的域名地址 验证分词效果
curl -H "Content-Type: application/json" -XPOST 'http://es.oso.plus:9200/_analyze?pretty' -d '{"text":"我们是致远人"}'
# 检查插件
http://172.18.2.230:9200/_cat/plugins
# 安装和配置 logstash
# rpm -ivh logstash-8.10.2-x86_64.rpm kibana-8.10.2-x86_64.rpm
mkdir -p /data/logstash/{data,logs}
chown -R logstash:logstash /data/logstash

sed -i 's%^path.data:.*%path.data: /data/logstash/data%' /etc/logstash/logstash.yml
sed -i 's%^path.logs:.*%path.logs: /data/logstash/logs%' /etc/logstash/logstash.yml

# vim /etc/logstash/logstash.yml
# path.data: /data/logstash/data
# path.logs: /data/logstash/logs

systemctl restart logstash
systemctl status logstash
systemctl enable logstash# 配置 logstash:输入为 kafka,输出为 elasticsearch。这个是百度的配置 未经我个人验证 暂时没时间折腾 有空再整
cat > /etc/logstash/conf.d/all.conf << 'EOF'
input{
  kafka {
    bootstrap_servers => "192.168.100.177:9092,192.168.100.178:9092,192.168.100.179:9092"
    codec => json
    topics => "httpd-access" # 匹配kafka中的主题
    consumer_threads => 1
    decorate_events => true
    type => "httpd-access"  ##用于输出时条件判断
  }
  kafka {
    bootstrap_servers => "192.168.100.177:9092,192.168.100.178:9092,192.168.100.179:9092"
    codec => json
    topics => "httpd-error"  ##匹配kafka中的主题
    consumer_threads => 1
    decorate_events => true
    type => "httpd-error"  ##用于输出时条件判断
  }
  kafka {
    bootstrap_servers => "192.168.100.177:9092,192.168.100.178:9092,192.168.100.179:9092"
    codec => json
    topics => "mariadb"  ##匹配kafka中的主题
    consumer_threads => 1
    decorate_events => true
    type => "mariadb"  ##用于输出时条件判断
  }
}
# 输出时如果满足type的判断条件,就按照指定索引输出到elasticsearch上。
output {
  if [type] == "httpd-access" {
    elasticsearch {
      hosts => ["192.168.100.177:9200","192.168.100.178:9200","192.168.100.179:9200"]
      index => "httpd-accesslog-%{+yyyy.MM.dd}"
    }
  }
  if [type] == "httpd-error" {
    elasticsearch {
      hosts => ["192.168.100.177:9200","192.168.100.178:9200","192.168.100.179:9200"]
      index => "httpd-errorlog-%{+yyyy.MM.dd}"
    }
  }
  if [type] == "mariadb" {
    elasticsearch {
      hosts => ["192.168.100.177:9200","192.168.100.178:9200","192.168.100.179:9200"]
      index => "mariadblog-%{+yyyy.MM.dd}"
    }
  }
}
EOF
# 安装和配置 kibana
ES集群部署时,不需要每台机子都装kibana,任意一台安装即可,或者使用一台单独的配置稍低的服务器进行安装。
当前测试,所以3台ES集群节点都部署了logstash和kibana。
# 安装和启动
# rpm -ivh logstash-8.9.0-x86_64.rpm kibana-8.9.0-x86_64.rpm
mkdir -p /data/kibana/{data,logs}
chown -R kibana:kibana /data/kibana

grep -n 'server.host' /etc/kibana/kibana.yml
grep -n '^elasticsearch' /etc/kibana/kibana.yml

ipAddr="$(ip addr | grep -Eo '([0-9]{1,3}\.){3}[0-9]{1,3}' | grep -Ev '127.0.0|0.0.0' | grep -v '.255' | head -1)"
sed -i "s%^#server.host: \"localhost\"%server.host: \"${ipAddr}\"%" /etc/kibana/kibana.yml
sed -i 's%^#elasticsearch.hosts:.*%elasticsearch.hosts: http://cop.oso.plus:9200%' /etc/kibana/kibana.yml

# elasticsearch.hosts 的值填写为 es-cluster 前端域名
vim /etc/kibana/kibana.yml
# i18n.locale: "zh-CN"
# server.port: 5601
# server.host: "192.168.100.177"
# elasticsearch.hosts: "http://cop.oso.plus:9200"
# elasticsearch.username: "kibana_system"
# elasticsearch.password: "i4Seeyon"
# path.data: /data/kibana/data
# fileName: /data/kibana/logs/kibana.log

systemctl restart kibana
systemctl status kibana
systemctl enable kibana

# 浏览器访问
http://192.168.100.177:5601
# kibana.yml 参数说明
server.port:
默认值: 5601 Kibana 由后端服务器提供服务,该配置指定使用的端口号。
server.host:
默认值: "localhost" 指定后端服务器的主机地址。
server.basePath:
如果启用了代理,指定 Kibana 的路径,该配置项只影响 Kibana 生成的 URLs,转发请求到 Kibana 时代理会移除基础路径值,该配置项不能以斜杠 (/)结尾。
server.maxPayloadBytes:
默认值: 1048576 服务器请求的最大负载,单位字节。
server.name:
默认值: "您的主机名" Kibana 实例对外展示的名称。
server.defaultRoute:
默认值: "/app/kibana" Kibana 的默认路径,该配置项可改变 Kibana 的登录页面。
elasticsearch.url:
默认值: "http://localhost:9200" 用来处理所有查询的 Elasticsearch 实例的 URL 。
elasticsearch.preserveHost:
默认值: true 该设置项的值为 true 时,Kibana 使用 server.host 设定的主机名,该设置项的值为 false 时,Kibana 使用主机的主机名来连接 Kibana 实例。
kibana.index:
默认值: ".kibana" Kibana 使用 Elasticsearch 中的索引来存储保存的检索,可视化控件以及仪表板。如果没有索引,Kibana 会创建一个新的索引。
kibana.defaultAppId:
默认值: "discover" 默认加载的应用。
tilemap.url:
Kibana 用来在 tile 地图可视化组件中展示地图服务的 URL。默认时,Kibana 从外部的元数据服务读取 url,用户也可以覆盖该参数,使用自己的 tile 地图服务。例如:"https://tiles.elastic.co/v2/default/{z}/{x}/{y}.png?elastic_tile_service_tos=agree&my_app_name=kibana"
tilemap.options.minZoom:
默认值: 1 最小缩放级别。
tilemap.options.maxZoom:
默认值: 10 最大缩放级别。
tilemap.options.attribution:
默认值: "© [Elastic Tile Service](https://www.elastic.co/elastic-tile-service)" 地图属性字符串。
tilemap.options.subdomains:
服务使用的二级域名列表,用 {s} 指定二级域名的 URL 地址。
elasticsearch.username: 和 elasticsearch.password:
Elasticsearch 设置了基本的权限认证,该配置项提供了用户名和密码,用于 Kibana 启动时维护索引。Kibana 用户仍需要 Elasticsearch 由 Kibana 服务端代理的认证。
server.ssl.enabled
默认值: "false" 对到浏览器端的请求启用 SSL,设为 true 时, server.ssl.certificate 和 server.ssl.key 也要设置。
server.ssl.certificate: 和 server.ssl.key:
PEM 格式 SSL 证书和 SSL 密钥文件的路径。
server.ssl.keyPassphrase
解密私钥的口令,该设置项可选,因为密钥可能没有加密。
server.ssl.certificateAuthorities
可信任 PEM 编码的证书文件路径列表。
server.ssl.supportedProtocols
默认值: TLSv1、TLSv1.1、TLSv1.2 版本支持的协议,有效的协议类型: TLSv1 、 TLSv1.1 、 TLSv1.2 。
server.ssl.cipherSuites
默认值: ECDHE-RSA-AES128-GCM-SHA256, ECDHE-ECDSA-AES128-GCM-SHA256, ECDHE-RSA-AES256-GCM-SHA384, ECDHE-ECDSA-AES256-GCM-SHA384, DHE-RSA-AES128-GCM-SHA256, ECDHE-RSA-AES128-SHA256, DHE-RSA-AES128-SHA256, ECDHE-RSA-AES256-SHA384, DHE-RSA-AES256-SHA384, ECDHE-RSA-AES256-SHA256, DHE-RSA-AES256-SHA256, HIGH,!aNULL, !eNULL, !EXPORT, !DES, !RC4, !MD5, !PSK, !SRP, !CAMELLIA. 具体格式和有效参数可通过[OpenSSL cipher list format documentation](https://www.openssl.org/docs/man1.0.2/apps/ciphers.html#CIPHER-LIST-FORMAT) 获得。
elasticsearch.ssl.certificate: 和 elasticsearch.ssl.key:
可选配置项,提供 PEM格式 SSL 证书和密钥文件的路径。这些文件确保 Elasticsearch 后端使用同样的密钥文件。
elasticsearch.ssl.keyPassphrase
解密私钥的口令,该设置项可选,因为密钥可能没有加密。
elasticsearch.ssl.certificateAuthorities:
指定用于 Elasticsearch 实例的 PEM 证书文件路径。
elasticsearch.ssl.verificationMode:
默认值: full 控制证书的认证,可用的值有 none 、 certificate 、 full 。 full 执行主机名验证,certificate 不执行主机名验证。
elasticsearch.pingTimeout:
默认值: elasticsearch.requestTimeout setting 的值,等待 Elasticsearch 的响应时间。
elasticsearch.requestTimeout:
默认值: 30000 等待后端或 Elasticsearch 的响应时间,单位微秒,该值必须为正整数。
elasticsearch.requestHeadersWhitelist:
默认值: [ 'authorization' ] Kibana 客户端发送到 Elasticsearch 头体,发送 no 头体,设置该值为[]。
elasticsearch.customHeaders:
默认值: {} 发往 Elasticsearch的头体和值, 不管 elasticsearch.requestHeadersWhitelist 如何配置,任何自定义的头体不会被客户端头体覆盖。
elasticsearch.shardTimeout:
默认值: 0 Elasticsearch 等待分片响应时间,单位微秒,0即禁用。
elasticsearch.startupTimeout:
默认值: 5000 Kibana 启动时等待 Elasticsearch 的时间,单位微秒。
pid.file:
指定 Kibana 的进程 ID 文件的路径。
logging.dest:
默认值: stdout 指定 Kibana 日志输出的文件。
logging.silent:
默认值: false 该值设为 true 时,禁止所有日志输出。
logging.quiet:
默认值: false 该值设为 true 时,禁止除错误信息除外的所有日志输出。
logging.verbose
默认值: false 该值设为 true 时,记下所有事件包括系统使用信息和所有请求的日志。
ops.interval
默认值: 5000 设置系统和进程取样间隔,单位微妙,最小值100。
status.allowAnonymous
默认值: false 如果启用了权限,该项设置为 true 即允许所有非授权用户访问 Kibana 服务端 API 和状态页面。
cpu.cgroup.path.override
如果挂载点跟 /proc/self/cgroup 不一致,覆盖 cgroup cpu 路径。
cpuacct.cgroup.path.override
如果挂载点跟 /proc/self/cgroup 不一致,覆盖 cgroup cpuacct 路径。
console.enabled
默认值: true 设为 false 来禁用控制台,切换该值后服务端下次启动时会重新生成资源文件,因此会导致页面服务有点延迟。
elasticsearch.tribe.url:
Elasticsearch tribe 实例的 URL,用于所有查询。
elasticsearch.tribe.username: 和 elasticsearch.tribe.password:
Elasticsearch 设置了基本的权限认证,该配置项提供了用户名和密码,用于 Kibana 启动时维护索引。Kibana 用户仍需要 Elasticsearch 由 Kibana 服务端代理的认证。
elasticsearch.tribe.ssl.certificate: 和 elasticsearch.tribe.ssl.key:
可选配置项,提供 PEM 格式 SSL 证书和密钥文件的路径。这些文件确保 Elasticsearch 后端使用同样的密钥文件。
elasticsearch.tribe.ssl.keyPassphrase
解密私钥的口令,该设置项可选,因为密钥可能没有加密。
elasticsearch.tribe.ssl.certificateAuthorities:
指定用于 Elasticsearch tribe 实例的 PEM 证书文件路径。
elasticsearch.tribe.ssl.verificationMode:
默认值: full 控制证书的认证,可用的值有 none 、 certificate 、 full 。 full 执行主机名验证, certificate 不执行主机名验证。
elasticsearch.tribe.pingTimeout:
默认值: elasticsearch.tribe.requestTimeout setting 的值,等待 Elasticsearch 的响应时间。
elasticsearch.tribe.requestTimeout:
Default: 30000 等待后端或 Elasticsearch 的响应时间,单位微秒,该值必须为正整数。
elasticsearch.tribe.requestHeadersWhitelist:
默认值: [ 'authorization' ] Kibana 发往 Elasticsearch 的客户端头体,发送 no 头体,设置该值为[]。
elasticsearch.tribe.customHeaders:
默认值: {} 发往 Elasticsearch的头体和值,不管 elasticsearch.tribe.requestHeadersWhitelist 如何配置,任何自定义的头体不会被客户端头体覆盖。
# v8-elk-1 的 kibana.yml
cat > /etc/kibana/kibana.yml << 'EOF'
server.port: 5601
server.host: "192.168.100.177"
#server.basePath: ""
#server.rewriteBasePath: false
server.publicBaseUrl: "http://cop.oso.plus:5601"
#server.maxPayload: 1048576
server.name: "v8-elk-1"
#server.ssl.enabled: false
#server.ssl.certificate: /path/to/your/server.crt
#server.ssl.key: /path/to/your/server.key
# elasticsearch.hosts: ["http://cop.oso.plus:9200"] # 接入es 的集群前端负载均衡
elasticsearch.hosts: ["http://192.168.100.177:9200", "http://192.168.100.178:9200", "http://192.168.100.179:9200"] # 接入es 集群的所有节点
#elasticsearch.username: "kibana_system"
#elasticsearch.password: "pass"
# elasticsearch.serviceAccountToken: "my_token"
#elasticsearch.pingTimeout: 1500
#elasticsearch.requestTimeout: 30000
#elasticsearch.maxSockets: 1024
#elasticsearch.compression: false
#elasticsearch.requestHeadersWhitelist: [ authorization ]
#elasticsearch.customHeaders: {}
#elasticsearch.shardTimeout: 30000
#elasticsearch.ssl.certificate: /path/to/your/client.crt
#elasticsearch.ssl.key: /path/to/your/client.key
#elasticsearch.ssl.certificateAuthorities: [ "/path/to/your/CA.pem" ]
#elasticsearch.ssl.verificationMode: full
#logging.root.level: debug
logging:
  appenders:
    file:
      type: file
      fileName: /data/kibana/logs/kibana.log
      layout:
        type: json
  root:
    appenders:
      - default
      - file
#  layout:
#    type: json
#logging.loggers:
#  - name: elasticsearch.query
#    level: debug
#logging.loggers:
#  - name: http.server.response
#    level: debug
#logging.loggers:
#  - name: metrics.ops
#    level: debug
path.data: /data/kibana/data
pid.file: /run/kibana/kibana.pid
#ops.interval: 5000
i18n.locale: "zh-CN"
#migrations.batchSize: 1000
#migrations.maxBatchSizeBytes: 100mb
#migrations.retryAttempts: 15
#unifiedSearch.autocomplete.valueSuggestions.timeout: 1000
#unifiedSearch.autocomplete.valueSuggestions.terminateAfter: 100000
EOF
# v8-elk-2 的 kibana.yml
cat > /etc/kibana/kibana.yml << 'EOF'
server.port: 5601
server.host: "192.168.100.178"
#server.basePath: ""
#server.rewriteBasePath: false
#server.publicBaseUrl: ""
#server.maxPayload: 1048576
server.name: "v8-elk-2"
#server.ssl.enabled: false
#server.ssl.certificate: /path/to/your/server.crt
#server.ssl.key: /path/to/your/server.key
# elasticsearch.hosts: ["http://cop.oso.plus:9200"] # 接入es 的集群前端负载均衡
elasticsearch.hosts: ["http://192.168.100.177:9200", "http://192.168.100.178:9200", "http://192.168.100.179:9200"] # 接入es 集群的所有节点
elasticsearch.cluster.name: "v8-elk-cluster"
elasticsearch.advanced.cluster.settings:
  join:
    enabled: true
    cluster_name: "v8-elk-cluster"
#elasticsearch.username: "kibana_system"
#elasticsearch.password: "pass"
# elasticsearch.serviceAccountToken: "my_token"
#elasticsearch.pingTimeout: 1500
#elasticsearch.requestTimeout: 30000
#elasticsearch.maxSockets: 1024
#elasticsearch.compression: false
#elasticsearch.requestHeadersWhitelist: [ authorization ]
#elasticsearch.customHeaders: {}
#elasticsearch.shardTimeout: 30000
#elasticsearch.ssl.certificate: /path/to/your/client.crt
#elasticsearch.ssl.key: /path/to/your/client.key
#elasticsearch.ssl.certificateAuthorities: [ "/path/to/your/CA.pem" ]
#elasticsearch.ssl.verificationMode: full
#logging.root.level: debug
logging:
  appenders:
    file:
      type: file
      fileName: /data/kibana/logs/kibana.log
      layout:
        type: json
  root:
    appenders:
      - default
      - file
#  layout:
#    type: json
#logging.loggers:
#  - name: elasticsearch.query
#    level: debug
#logging.loggers:
#  - name: http.server.response
#    level: debug
#logging.loggers:
#  - name: metrics.ops
#    level: debug
path.data: /data/kibana/data
pid.file: /run/kibana/kibana.pid
#ops.interval: 5000
i18n.locale: "zh-CN"
#migrations.batchSize: 1000
#migrations.maxBatchSizeBytes: 100mb
#migrations.retryAttempts: 15
#unifiedSearch.autocomplete.valueSuggestions.timeout: 1000
#unifiedSearch.autocomplete.valueSuggestions.terminateAfter: 100000
EOF
# v8-elk-3 的 kibana.yml
cat > /etc/kibana/kibana.yml << 'EOF'
server.port: 5601
server.host: "192.168.100.179"
#server.basePath: ""
#server.rewriteBasePath: false
#server.publicBaseUrl: ""
#server.maxPayload: 1048576
server.name: "v8-elk-3"
#server.ssl.enabled: false
#server.ssl.certificate: /path/to/your/server.crt
#server.ssl.key: /path/to/your/server.key
# elasticsearch.hosts: ["http://cop.oso.plus:9200"] # 接入es 的集群前端负载均衡
elasticsearch.hosts: ["http://192.168.100.177:9200", "http://192.168.100.178:9200", "http://192.168.100.179:9200"] # 接入es 集群的所有节点
#elasticsearch.username: "kibana_system"
#elasticsearch.password: "pass"
# elasticsearch.serviceAccountToken: "my_token"
#elasticsearch.pingTimeout: 1500
#elasticsearch.requestTimeout: 30000
#elasticsearch.maxSockets: 1024
#elasticsearch.compression: false
#elasticsearch.requestHeadersWhitelist: [ authorization ]
#elasticsearch.customHeaders: {}
#elasticsearch.shardTimeout: 30000
#elasticsearch.ssl.certificate: /path/to/your/client.crt
#elasticsearch.ssl.key: /path/to/your/client.key
#elasticsearch.ssl.certificateAuthorities: [ "/path/to/your/CA.pem" ]
#elasticsearch.ssl.verificationMode: full
#logging.root.level: debug
logging:
  appenders:
    file:
      type: file
      fileName: /data/kibana/logs/kibana.log
      layout:
        type: json
  root:
    appenders:
      - default
      - file
#  layout:
#    type: json
#logging.loggers:
#  - name: elasticsearch.query
#    level: debug
#logging.loggers:
#  - name: http.server.response
#    level: debug
#logging.loggers:
#  - name: metrics.ops
#    level: debug
path.data: /data/kibana/data
pid.file: /run/kibana/kibana.pid
#ops.interval: 5000
i18n.locale: "zh-CN"
#migrations.batchSize: 1000
#migrations.maxBatchSizeBytes: 100mb
#migrations.retryAttempts: 15
#unifiedSearch.autocomplete.valueSuggestions.timeout: 1000
#unifiedSearch.autocomplete.valueSuggestions.terminateAfter: 100000
EOF# 重启 kibana 服务并等待 3 秒后查看服务状态
systemctl restart kibana; sleep 3; systemctl status kibana
# 启用ES集群的监控数据收集
复制以下内容,粘贴进控制台,并点击右上的 运行 按钮。
PUT _cluster/settings
{
  "persistent": {
    "xpack.monitoring.collection.enabled": true
  }
}
运行成功后,即可查看监控数据。
从下图可看到,es有3个节点,kibana有3个实例。
# 配置 nginx 代理
在 nginx 服务器上执行。关于安装 nginx 的方法在本文不做赘述。
# elasticsearch
vim /apps/nginx/conf.d/http/elasticsearch.conf
upstream es-cluster {
    # session_sticky;
    # ip_hash;
    # 修改和增删后端服务器
    server 192.168.100.177:9200;
    server 192.168.100.178:9200;
    server 192.168.100.179:9200;
    # 我这里使用的是 tengine 健康检查模块
    # 请参考官方文档: http://tengine.taobao.org/document_cn/http_upstream_check_cn.html
    check interval=3000 rise=2 fall=5 timeout=1000 type=http;
    check_keepalive_requests 100;
    check_http_send "HEAD / HTTP/1.1\r\nConnection: keep-alive\r\n\r\n";
    check_http_expect_alive http_2xx http_3xx;
}

server {
    listen 9200;
    listen [::]:9200;
    server_name cop.oso.plus;
    charset utf-8;

    # 开启 SSL 时的证书配置
    # ssl_protocols TLSv1.2 TLSv1.3;
    # ssl_certificate "/apps/nginx/certs/oso.plus.crt";
    # ssl_certificate_key "/apps/nginx/certs/oso.plus.key";
    # ssl_session_cache shared:SSL:1m;
    # ssl_session_timeout 5m;
    # ssl_ciphers ECDHE-RSA-AES128-GCM-SHA256:ECDHE:ECDH:AES:HIGH:!NULL:!aNULL:!MD5:!ADH:!RC4;
    # ssl_prefer_server_ciphers on;

    ignore_invalid_headers off;
    client_max_body_size 0;
    proxy_buffering off;

    location / {
        proxy_set_header Host $http_host;
        proxy_set_header X-Real-IP $remote_addr;
        proxy_set_header X-Forwarded-For $proxy_add_x_forwarded_for;
        proxy_set_header X-Forwarded-Proto $scheme;
        proxy_http_version 1.1;
        chunked_transfer_encoding off;

        # 添加 websocket 支持
        proxy_set_header Upgrade $http_upgrade;
        proxy_set_header Connection "upgrade";
        proxy_headers_hash_max_size 51200;
        proxy_headers_hash_bucket_size 6400;

        proxy_pass http://es-cluster;
    }

    # 健康检查页面
    location /status {
        check_status;
        access_log off;
        # allow SOME.IP.ADD.RESS;
        # deny all;
    }

    # 错误页面重定向配置
    error_page 500 502 503 504 /50x.html;
    location = /50x.html {
        # root /path/to/html/files;
        internal;
    }

    # es-cluster 访问日志记录
    access_log logs/www_access_es_cluster.log main;
}
在 /apps/nginx/conf/nginx.conf 文件中添加 include /apps/nginx/conf.d/http/elasticsearch.conf; 并 reload 一下 nginx。
# kibana
# 添加密码认证
dnf install -y httpd-tools
htpasswd -bc /apps/nginx/conf.d/htpasswd.users admin i4Seeyon
cat /apps/nginx/conf.d/htpasswd.users
systemctl reload nginx

# openssl passwd -1 -in admin > /etc/nginx/conf.d/htpasswd.users
cat /apps/nginx/conf.d/http/kibana.conf
upstream kibana-cluster {
    server 192.168.100.177:5601 weight=1 max_fails=3 fail_timeout=60;
    server 192.168.100.178:5601 weight=1 max_fails=3 fail_timeout=60;
    server 192.168.100.179:5601 weight=1 max_fails=3 fail_timeout=60;
}

server {
    listen 5601;
    server_name cop.oso.plus;
    # auth_basic "Restricted Access";
    # auth_basic_user_file /etc/nginx/conf.d/htpasswd.users;
    location / {
        proxy_pass http://kibana-cluster;
        proxy_http_version 1.1;
        proxy_set_header Upgrade $http_upgrade;
        proxy_set_header Connection 'upgrade';
        proxy_set_header Host $host;
        proxy_cache_bypass $http_upgrade;
    }
}
在 /apps/nginx/conf/nginx.conf 文件中添加 include /apps/nginx/conf.d/http/kibana.conf; 并 reload 一下 nginx。
# 卸载
# elk
yum remove -y elasticsearch logstash kibana
# elasticsearch
# 停止 Elasticsearch 服务。
systemctl stop elasticsearch
# 禁用 Elasticsearch 服务,以确保它不会在系统启动时自动启动。
systemctl disable elasticsearch
# 卸载 Elasticsearch 软件包。
yum remove -y elasticsearch
# 删除 Elasticsearch 数据目录。默认情况下,数据目录位于 /var/lib/elasticsearch。请注意,这将删除所有 Elasticsearch 数据和配置文件。
rm -rf /var/lib/elasticsearch
# 清理残留的 Elasticsearch 配置文件。这些文件可能包括 /etc/elasticsearch/ 和 /etc/yum.repos.d/ 中的相关文件。
rm -rf /etc/elasticsearch
# logstash
略
# 卸载kibana
略
# 常用命令
# 查看版本 - 需启动服务
curl -X GET localhost:9200
# 检查是否开启安全认证
grep -n xpack.security.enabled /etc/elasticsearch/elasticsearch.yml
# 重置默认密码
/usr/share/elasticsearch/bin/elasticsearch-reset-password -u elastic
# 检查服务是否OK 由于默认开启了 https 所以要带上 https:// 网上都不带协议 TMD的鬼扯
curl -H "Expect:" -X GET "localhost:9200"
curl -vkL -X GET "https://localhost:9200" -H "Expect:" -u elastic:Z+2VlqW-_sudV+o9hEx9
# 检查节点健康状态 "status":"green" 则OK
curl -vkL -X GET "https://localhost:9200/_cluster/health" -H "Expect:" -u elastic:Z+2VlqW-_sudV+o9hEx9

curl -k -X DELETE "https://localhost:9200/.security-*" -u "elastic:i4Seeyon"
# elasticsearch的curl命令大全
?v 打印出表头信息
?pretty 美化输出
transient 表示临时
persistent表示永久
delay=10s表示延迟10秒关闭

一、_cat
查看具体命令 curl localhost:9200/_cat
1.集群健康状态
/_cat/health
2.资源信息
/_cat/allocation
3.查看文档总数
/_cat/count
4.查看具体索引的文档总数
/_cat/count/{index}
5.查看fielddata占用内存情况(查询时es会把fielddata信息load进内存)
/_cat/fielddata
6.针对某一字段进行查看
/_cat/fielddata/{fields}
7.查看数据恢复状态
/_cat/recovery
8.查看具体索引的数据恢复状态
/_cat/recovery/{index}
9.查看存储片段信息
/_cat/segments
10.查看具体索引的存储片段信息
/_cat/segments/{index}
11.查看节点状态
/_cat/nodes
12.查看别名信息
/_cat/aliases
13.指定别名查看信息
/_cat/aliases/{alias}
14.查看线程池信息
/_cat/thread_pool
15.查看线程池下插件
/_cat/thread_pool/{thread_pools}/_cat/plugins
16.查看主节点
/_cat/master
17.查看快照库
/_cat/snapshots/{repository}
18.查看模板
/_cat/templates
19.查看存储库
/_cat/repositories
20.查看索引信息
/_cat/indices
21.查看具体索引信息
/_cat/indices/{index}
22.查看任务
/_cat/tasks
23.查看待处理任务
/_cat/pending_tasks
24.查看分片信息
/_cat/shards
25.查看具体索引的分片信息
/_cat/shards/{index}
26.查看节点的自定义属性
/_cat/nodeattrs
27.查看插件信息
/_cat/plugins

二、_cluster
1.查看集群状态
/_cluster/health
2.查看集群系统信息
/_cluster/stats?pretty=true
3.查看集群详细信息
/_cluster/state?pretty=true
4.查看集群堆积的任务
/_cluster/pending_tasks?pretty=true
5.修改集群配置(-XPUT)
/_cluster/settings -d ‘{
"persistent” : {
"discovery.zen.minimum_master_nodes” : 2
}
}'
6.对shard的手动控制(-XPOST)
/_cluster/reroute' -d ‘xxxxxx'
7.关闭节点(-XPOST)
a.关闭指定127.0.0.1节点
/_cluster/nodes/_local/_shutdown'
/_cluster/nodes/192.168.1.1/_shutdown'
b.关闭主节点
/_cluster/nodes/_master/_shutdown'
c.关闭整个集群
/_shutdown?delay=10s'
/_cluster/nodes/_shutdown'
/_cluster/nodes/_all/_shutdown'

三、_nodes
1.集群JVM状态
/_nodes/stats/jvm
2.查询节点状态
/_nodes/stats?pretty=true'
/_nodes/192.168.1.2/stats?pretty=true'
/_nodes/process'
/_nodes/_all/process'
/_nodes/192.168.1.2,192.168.1.3/jvm,process'
/_nodes/192.168.1.2,192.168.1.3/info/jvm,process'
/_nodes/192.168.1.2,192.168.1.3/_all
/_nodes/hot_threads
四、CURD
1.查询数据
curl -XGET ‘http://localhost:9200/{index}/{type}/{id}'
2.索引(插入)数据
curl -XPOST ‘http://localhost:9200/{index}/{type}/{id}' -d'{"key”:”value”,"key”:”value”}'
3.批量导入数据(在a.json文件所在当前文件下)
curl -XPOST ‘localhost:9200/{index}/{type}/_bulk' --data-binary "@a.json”
4.删除数据
curl -XDELETE ‘http://localhost:9200/{index}/{type}/{id}'
5.按照查询结果删除数据
curl -XPOST ‘localhost:9200/{index}/{type}/_delete_by_query?pretty' -d'
{"query”: {"query_string”: {"message”: "some message”}}}'
五、settings
1.修改分片数
curl -XPUT ‘http://localhost:9200/_all/_settings?preserve_existing=true' -d ‘{
"index.number_of_shards” : "3”}'
2.修改副本数
curl -XPUT ‘http://115.28.157.41:9222/_all/_settings' -d ' {
"index.number_of_replicas”:"0”}'
** 分片数在有数据之后不能再改动,副本数可以随时修改。
六、es服务启动自动分片失败,报出集群状态为red或yellow
1.查看未分配分片
curl -XGET ‘http://localhost:9200/_cat/shards' | grep UNASSIGNED
2.手动分片
curl -XPOST ‘localhost:9200/_cluster/reroute' -d ‘{
"commands”: [{
"allocate”: {
"index”: "index-name”,
"shard”: 0,
"node”: "node-0”,
"allow_primary”: false
}
}]
}'
# xpack
https://www.elastic.co/guide/en/elasticsearch/reference/current/security-basic-setup.html https://www.elastic.co/guide/en/elasticsearch/reference/7.15/security-basic-setup.html
# elasticsearch
# 生成CA
{ echo; echo; } | elasticsearch-certutil ca --days 3650 --keysize 4096 --out /etc/elasticsearch/certs/elastic-stack-ca.p12 --silent
# 生成证书
{ echo; echo; echo; } | elasticsearch-certutil cert --ca /etc/elasticsearch/certs/elastic-stack-ca.p12 --out /etc/elasticsearch/certs/elastic-certificates.p12 --dns "${certDnsList}" --ip "${certIpList}" --silent
# logstash
openssl pkcs12 -in "${eCrtP12}" -cacerts -nokeys -out "${eCaPEM}" -passin pass:

# 证书转换
openssl pkcs12 -in /etc/logstash/certs/elastic-certificates.p12 -clcerts -nokeys -out /etc/logstash/certs/elastic-certificate.pem
openssl pkcs12 -in /etc/logstash/certs/elastic-certificates.p12 -nocerts -nodes -out /etc/logstash/certs/elastic-key.pem

# filebeat
openssl pkcs12 -in /etc/filebeat/certs/elastic-certificates.p12 -clcerts -nokeys -out /etc/filebeat/certs/elastic-certificate.pem
openssl pkcs12 -in /etc/filebeat/certs/elastic-certificates.p12 -nocerts -nodes -out /etc/filebeat/certs/elastic-key.pem

output.elasticsearch:
  hosts: ["your_elasticsearch_hosts"]
  ssl:
    certificate: "/etc/filebeat/certs/elastic-certificate.pem"
    key: "/etc/filebeat/certs/elastic-key.pem"
    certificate_authorities: ["/etc/filebeat/certs/elastic-ca.pem"]
    # 其他相关配置...
# kibana
# 证书转换
openssl pkcs12 -in /etc/kibana/certs/elastic-certificates.p12 -clcerts -nokeys -out /etc/kibana/certs/elastic-crt.pem
openssl pkcs12 -in /etc/kibana/certs/elastic-certificates.p12 -nocerts -nodes -out /etc/kibana/certs/elastic-key.pem

# kibana.yml 配置
elasticsearch.hosts: ["https://192.168.100.171:9200","https://192.168.100.172:9200","https://192.168.100.173:9200"]
elasticsearch.username: "elastic"
elasticsearch.password: "xY6FFLXCRoMBPD9VpI04"
elasticsearch.ssl.certificate: /etc/kibana/certs/elastic-certificate.pem
elasticsearch.ssl.key: /etc/kibana/certs/elastic-key.pem
elasticsearch.ssl.certificateAuthorities: [ "/etc/kibana/certs/elastic-ca.pem" ]
elasticsearch.ssl.verificationMode: certificate
# 使用elasticsearch-create-enrollment-token实现自动加入集群
注意事项:
1、只支持8.x/9.x 不支持7.x
2、仅首节点设置 cluster.initial_master_nodes 参数 其余节点不要设置 集群成功组建后需要注释掉
3、以下参数必须设置为 true
xpack.security.enabled: true
xpack.security.http.ssl.enabled: true
xpack.security.transport.ssl.enabled: true
安装完毕之后不启动,先调整elasticsearch.yml这个配置文件。以下使用tgz安装举例,deb或rpm的方式基本类似。
首节点[192.168.100.204]确保以下关键参数以正确设置:
# es-1
cluster.name: es-cluster
node.name: es-1
path.data: /data/elasticsearch/data
path.logs: /data/elasticsearch/logs
bootstrap.memory_lock: false
network.host: 192.168.100.204
http.port: 9200
discovery.seed_hosts: ["192.168.100.204", "192.168.100.205", "192.168.100.206"]
cluster.initial_master_nodes: ["192.168.100.204", "192.168.100.205", "192.168.100.206"]
action.destructive_requires_name: true
xpack.security.enabled: true
xpack.security.enrollment.enabled: true
xpack.security.http.ssl:
  enabled: true
  keystore.path: certs/http.p12
xpack.security.transport.ssl:
  enabled: true
  verification_mode: certificate
  keystore.path: certs/transport.p12
  truststore.path: certs/transport.p12
# 把 token 记录下来备用 30分钟内有效
/apps/elasticsearch/bin/elasticsearch-create-enrollment-token -s node
systemctl daemon-reload
systemctl enable elasticsearch
systemctl start elasticsearch
其余节点确保以下关键参数以正确设置:
# es-2
cluster.name: es-cluster
node.name: es-2
path.data: /data/elasticsearch/data
path.logs: /data/elasticsearch/logs
bootstrap.memory_lock: false
network.host: 192.168.100.205
http.port: 9200
discovery.seed_hosts: ["192.168.100.204", "192.168.100.205", "192.168.100.206"]
#cluster.initial_master_nodes: ["192.168.100.204", "192.168.100.205", "192.168.100.206"]
action.destructive_requires_name: true
xpack.security.enabled: true
xpack.security.enrollment.enabled: true
xpack.security.http.ssl:
  enabled: true
  keystore.path: certs/http.p12
xpack.security.transport.ssl:
  enabled: true
  verification_mode: certificate
  keystore.path: certs/transport.p12
  truststore.path: certs/transport.p12
/apps/elasticsearch/bin/elasticsearch-reconfigure-node --enrollment-token eyJ2ZXIiOiI4LjE0LjAiLCJhZHIiOlsiMTkyLjE2OC4xMDAuMjA0OjkyMDAiXSwiZmdyIjoiOTRjNjZlMzNhZGY2NTgxYjQxMTQxM2E2MjUyNjBlOGNjNzAzOTMxYWM5NDAxYjhmMDY2ZmNlYWNkMDdlOTU1NCIsImtleSI6ImhaOExhcGtCaTVMYXZTZ0duTzIwOjNfdFZWQWFDbGNVYk0wVVFBMVdTMWcifQ==

systemctl daemon-reload
systemctl enable elasticsearch
systemctl start elasticsearch
# es-3
cluster.name: es-cluster
node.name: es-3
path.data: /data/elasticsearch/data
path.logs: /data/elasticsearch/logs
bootstrap.memory_lock: false
network.host: 192.168.100.206
http.port: 9200
discovery.seed_hosts: ["192.168.100.204", "192.168.100.205", "192.168.100.206"]
#cluster.initial_master_nodes: ["192.168.100.204", "192.168.100.205", "192.168.100.206"]
action.destructive_requires_name: true
xpack.security.enabled: true
xpack.security.enrollment.enabled: true
xpack.security.http.ssl:
  enabled: true
  keystore.path: certs/http.p12
xpack.security.transport.ssl:
  enabled: true
  verification_mode: certificate
  keystore.path: certs/transport.p12
  truststore.path: certs/transport.p12
/apps/elasticsearch/bin/elasticsearch-reconfigure-node --enrollment-token eyJ2ZXIiOiI4LjE0LjAiLCJhZHIiOlsiMTkyLjE2OC4xMDAuMjA0OjkyMDAiXSwiZmdyIjoiOTRjNjZlMzNhZGY2NTgxYjQxMTQxM2E2MjUyNjBlOGNjNzAzOTMxYWM5NDAxYjhmMDY2ZmNlYWNkMDdlOTU1NCIsImtleSI6ImhaOExhcGtCaTVMYXZTZ0duTzIwOjNfdFZWQWFDbGNVYk0wVVFBMVdTMWcifQ==

systemctl daemon-reload
systemctl enable elasticsearch
systemctl start elasticsearch
快速跳转
