# Prometheus 生态采集器与中间件对应表
| 序号 | 采集对象 | 对应的采集器 | 功能作用 | 官方地址 | 镜像地址 | 补充说明 |
|---|---|---|---|---|---|---|
| 1 | prometheus | 自身内置采集 | 核心监控引擎,拉取所有 Exporter/采集器的 metrics 指标,存储、规则计算、告警触发 | https://github.com/prometheus/prometheus | https://hub.docker.com/r/prom/prometheus | 无独立采集器,自身为监控核心,需配置 scrape_configs |
| 2 | alertmanager | 自身无采集器 | 接收 Prometheus 告警,做去重/分组/路由,发送多种告警通知 | https://github.com/prometheus/alertmanager | https://hub.docker.com/r/prom/alertmanager | 仅告警管理组件 |
| 3 | pushgateway | 指标接收端 | 接收短生命周期任务指标,供 Prometheus 拉取 | https://github.com/prometheus/pushgateway | https://hub.docker.com/r/prom/pushgateway | 解决短任务指标问题 |
| 4 | 主机 | node-exporter | CPU / 内存 / 磁盘 / 网络 / 内核等 | https://github.com/prometheus/node-exporter | https://hub.docker.com/r/prom/node-exporter | 每台主机需部署 |
| 5 | MySQL | mysqld-exporter | 连接数 / 慢查询 / 主从 / IO | https://github.com/prometheus/mysqld-exporter | https://hub.docker.com/r/prom/mysqld-exporter | 推荐同机部署 |
| 6 | 达梦 | dameng_exporter | 会话 / 锁 / 执行计划 / 实例状态 | https://github.com/gaoyuan98/dameng_exporter | https://hub.docker.com/r/gaoyuan98/dameng_exporter | 同机部署 |
| 7 | Nginx | nginx-vts-exporter | 请求 / 状态码 / 流量 / 上游 | https://github.com/sysulq/nginx-vts-exporter | https://hub.docker.com/r/sophos/nginx-vts-exporter | 需开启 vts |
| 8 | PostgreSQL | postgres-exporter | 事务 / 连接 / 表空间 | https://github.com/prometheus-community/postgres_exporter | https://hub.docker.com/r/prometheuscommunity/postgres-exporter | 只读账号 |
| 9 | Elasticsearch | elasticsearch-exporter | 集群 / 节点 / 分片 / 性能 | https://github.com/prometheus-community/elasticsearch_exporter | https://hub.docker.com/r/prometheuscommunity/elasticsearch-exporter | 可远程 |
| 10 | Redis | redis_exporter | 内存 / 命中率 / 主从 | https://github.com/oliver006/redis_exporter | https://hub.docker.com/r/oliver006/redis_exporter | 支持集群 |
| 11 | Kafka | kafka-exporter | 分区 / 副本 / offset | https://github.com/danielqsj/kafka-exporter | https://hub.docker.com/r/danielqsj/kafka-exporter | Broker 部署 |
| 12 | 探测 | blackbox-exporter | HTTP/TCP/ICMP 可用性 | https://github.com/prometheus/blackbox-exporter | https://hub.docker.com/r/prom/blackbox-exporter | 黑盒 |
| 13 | ClickHouse | 内置 | 查询 / 副本 / 节点状态 | https://clickhouse.com/docs/zh/operations/monitoring/prometheus | — | 直接拉取 |
| 14 | Nacos | 内置 | 注册 / 配置 / 节点状态 | https://nacos.io/zh-cn/docs/monitor-guide.html | — | 直接拉取 |
| 15 | Oracle | 官方插件 | 会话 / 表空间 | https://github.com/oracle/oracle-db-appdev-monitoring | — | 官方方案 |
| 16 | MinIO | 内置 | 存储 / 性能 | https://min.io/docs/minio/linux/operations/monitoring/metrics-and-alerts.html | — | 启动参数 |
| 17 | Harbor | 内置 | 镜像 / 节点 | https://goharbor.io/docs/latest/administration/monitoring/ | — | 默认开启 |
| 18 | Nexus | 内置 | 仓库 / 存储 | https://help.sonatype.com/nexus-repository-manager/monitoring/metrics | — | 直接拉取 |
| 19 | GitLab | 内置 | CI/CD / 服务 | https://docs.gitlab.com/ee/administration/monitoring/prometheus/ | — | 内置 Prom |
| 20 | Kubernetes | kube-state-metrics | 资源对象状态 | https://github.com/kubernetes/kube-state-metrics | registry.k8s.io/kube-state-metrics/kube-state-metrics | 必装 |
# 注意事项
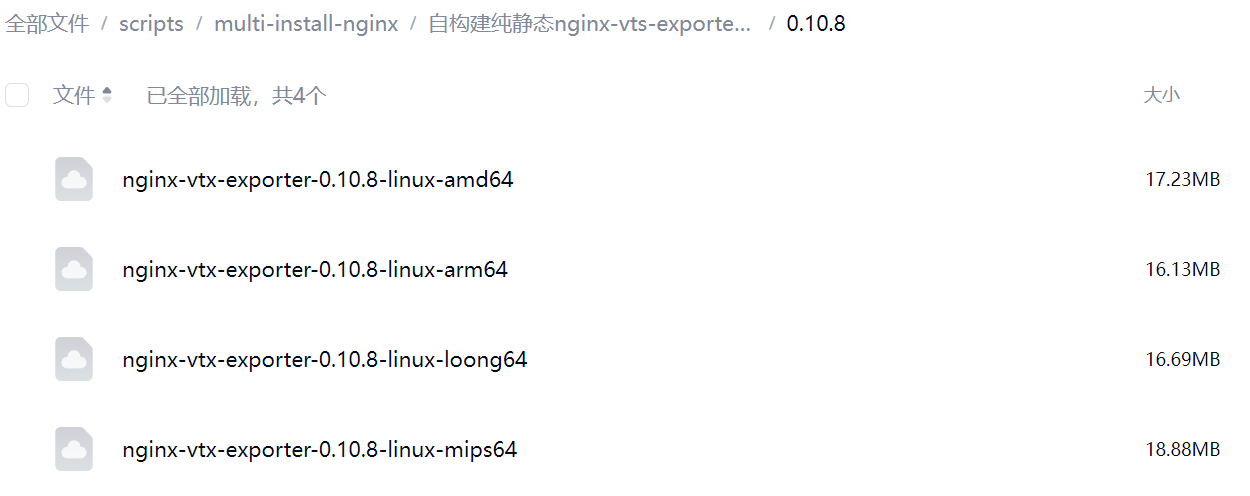
nginx如果使用vts的exporter进行数据采集,需要注意官方发行的二进制,由于最低要求 glibc 2.32.0,所以不支持 rhel 7.x 这类比较老的操作系统。推荐个人自行编译构建。
在网盘有预编译好的 amd64、arm64、loong64、mips64 这4个硬件平台下的纯静态二进制版本,提供给需要的同事下载使用。
https://pan.baidu.com/s/1uY5lQ0miwaFJSJjE76_AzA?pwd=f2dg
编撰人:het、yangfc
← 阿里云云效配置 v8中间件容器化部署工具 →
